How to Measure Help Center Effectiveness: 7 Metrics That Matter
Track these 7 help center metrics — from self-service rate to failed searches — to cut support tickets and prove ROI to your team.

You launched a help center six months ago. You wrote 40 articles, organized them into categories, and added a search bar. Support tickets… did not drop. What went wrong?
Probably nothing dramatic. You just never measured what was working and what was not. Without metrics, a help center is a guess. With the right ones, it becomes your most efficient support channel — handling 2-5x more queries than a human agent at a fraction of the cost.
Here are the seven metrics that separate useful help centers from expensive content graveyards.
1. Self-Service Rate
This is the headline number: what percentage of users who visit your help center resolve their issue without filing a ticket? Industry benchmarks hover around 40-60% for mature help centers. If yours is below 30%, your content has gaps or your search is broken.
How to calculate it: (Help center sessions - tickets created within 30 minutes of a session) / Help center sessions.
2. Search Success Rate
When someone searches your help center, do they find what they need? Track the ratio of searches that lead to an article click versus searches that lead to a second search, an exit, or a ticket. A healthy help center converts 70%+ of searches into article views.
3. Failed Searches
This is the most actionable metric on the list. Failed searches — queries that return zero results — tell you exactly what content to create next. If 50 people search “SSO setup” this month and get nothing, that is a clear signal. Track the top 10 failed searches weekly and turn them into articles.
4. Article Helpfulness Score
The thumbs-up/thumbs-down widget at the bottom of articles is not decoration. It is direct user feedback at scale. Aim for 70%+ positive ratings across your help center. Articles scoring below 50% need a rewrite — the content is either outdated, unclear, or answering the wrong question.
5. Contact Rate After Article View
If someone reads an article and then immediately opens a support ticket, the article failed them. Track this “escalation rate” per article. High-escalation articles need better content, clearer steps, or additional context. A good benchmark: under 10% escalation rate per article.
6. Time to Resolution via Self-Service
How long does it take a user to find and consume the answer? If the average self-service session is 8+ minutes, your information architecture needs work — users are hunting, not finding. Well-organized help centers resolve queries in 2-4 minutes.
7. Top Viewed Articles
Your most-viewed articles deserve the most attention. They are the ones customers need most, so they should be the best-written, most up-to-date, and easiest to find. Review your top 10 monthly and ask: is each one still accurate? Is the title clear? Does it actually solve the problem?
Turning Metrics Into Action
Numbers alone do not improve anything. Here is a simple monthly review process:
- Pull your top 10 failed searches. Create or update articles for each one.
- Review articles with helpfulness below 50%. Rewrite or merge them.
- Check escalation rates on your top 20 articles. Fix the ones pushing users to tickets.
- Compare self-service rate month over month. If it is flat, your new content is not reaching users — check search and navigation.
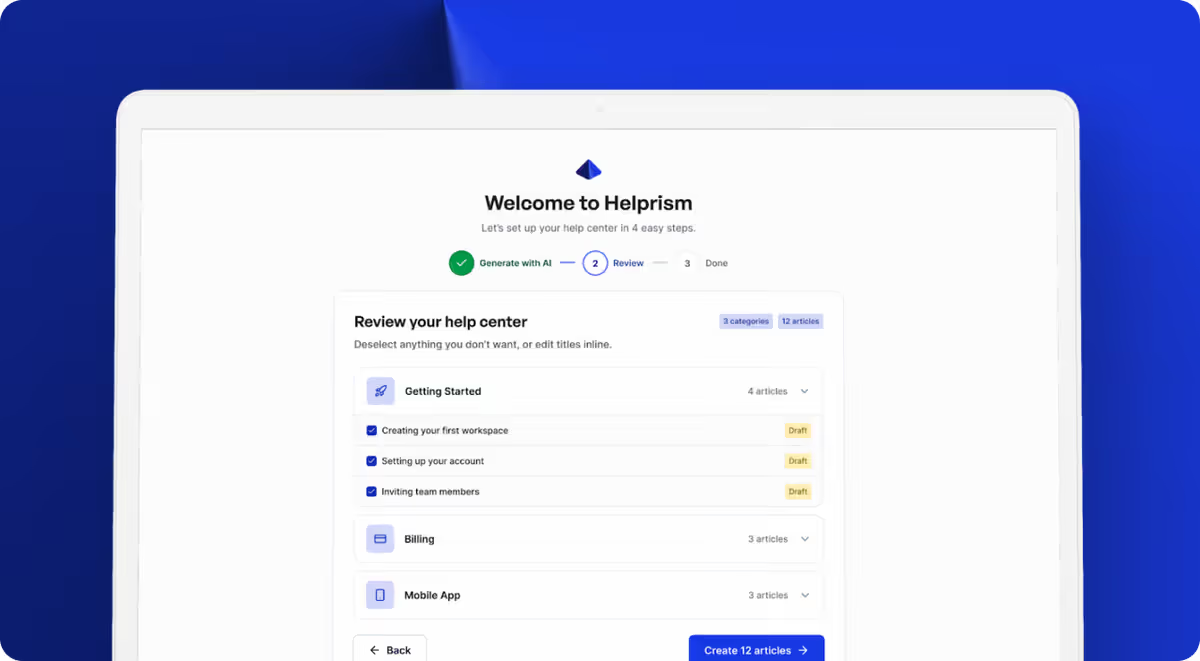
How Helprism Makes Measurement Easy
Most help center tools either give you no analytics or bury them behind enterprise pricing. Helprism includes a full analytics dashboard on every plan.
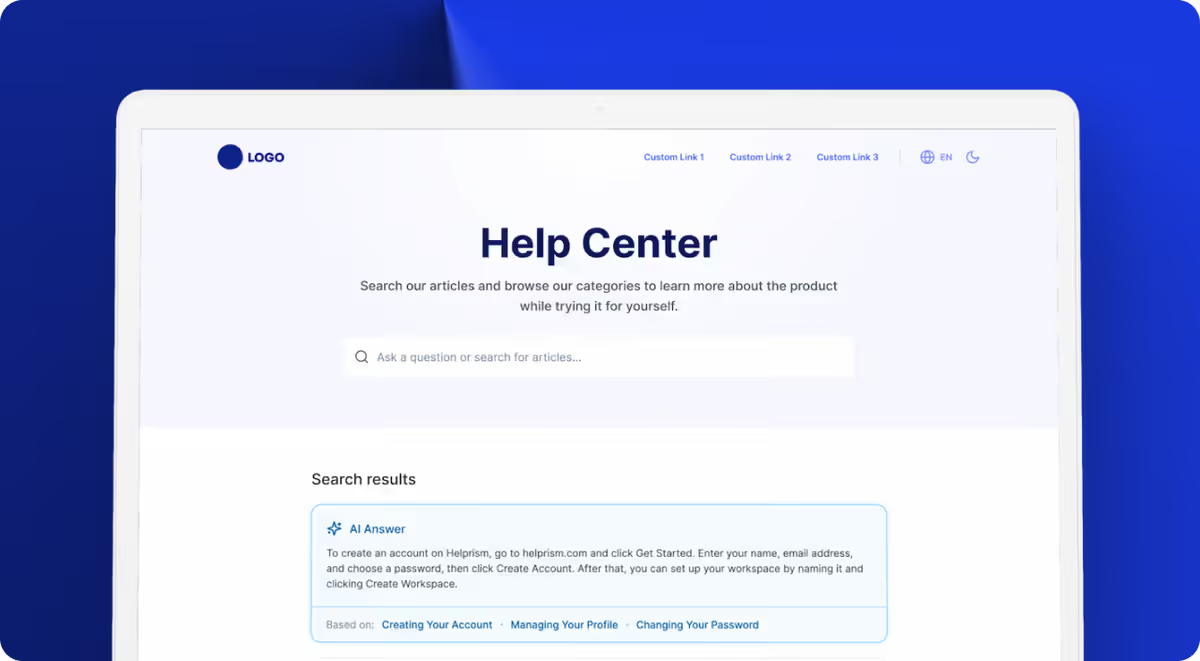
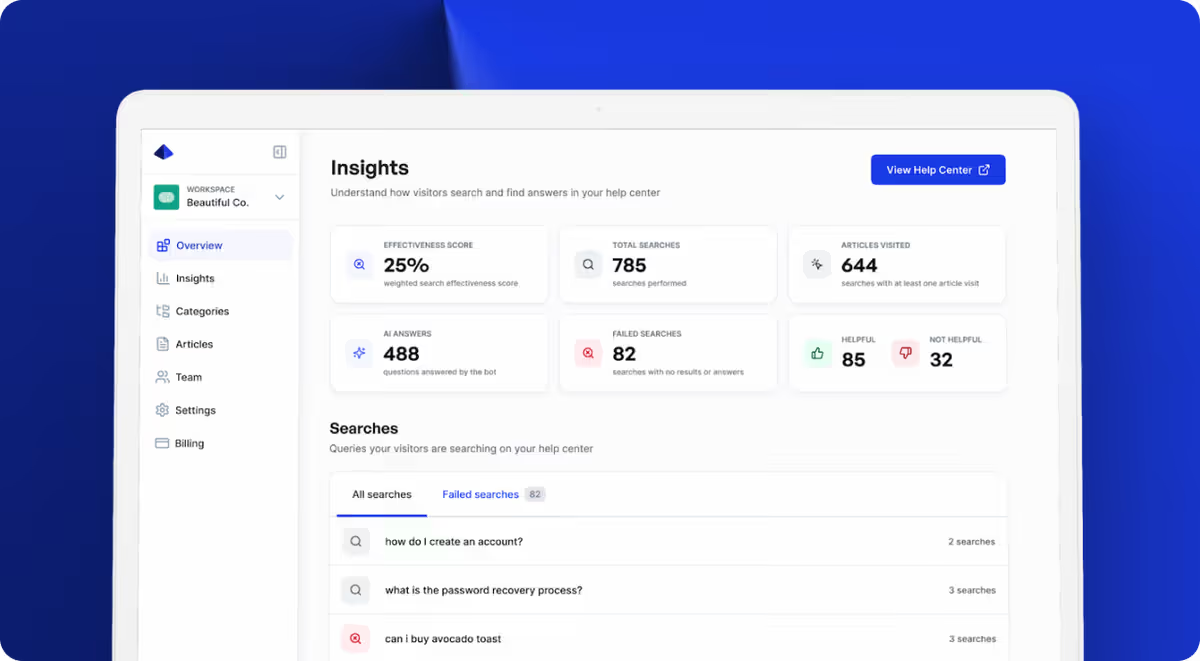
The Helprism insights dashboard tracks search effectiveness, surfaces failed searches, and collects article-level feedback — the exact metrics covered above. The AI answer bot also reduces escalation by giving users instant, article-sourced answers before they reach for the contact form. Free plan includes 10 articles for 1 user at $0, scaling through Starter ($19/mo), Pro ($49/mo), and Business ($99/mo).
Stop Guessing, Start Measuring
A help center without metrics is just a content dump. The seven metrics above give you a clear picture of what is working, what is broken, and what to build next. Measure monthly, act on the data, and your help center becomes the support channel that actually scales.
Ready to get started?
Paste your URL. Review the draft. Publish. Your help center is live before your coffee gets cold.
Start Free →